Logs filtering and keyword search
@Phoebe Show me all logs from the production-web-clusterin the last 15 minutes.@Phoebe Search for logs mentioning user_id: '1a2b3c4d' across all systems yesterday.@Phoebe Find all logs containing the string ClientNotAvailableError from the last day in the app-cluster-prod environment.@Phoebe Give me all the 429 errors in the last 2 hours.Troubleshooting issues
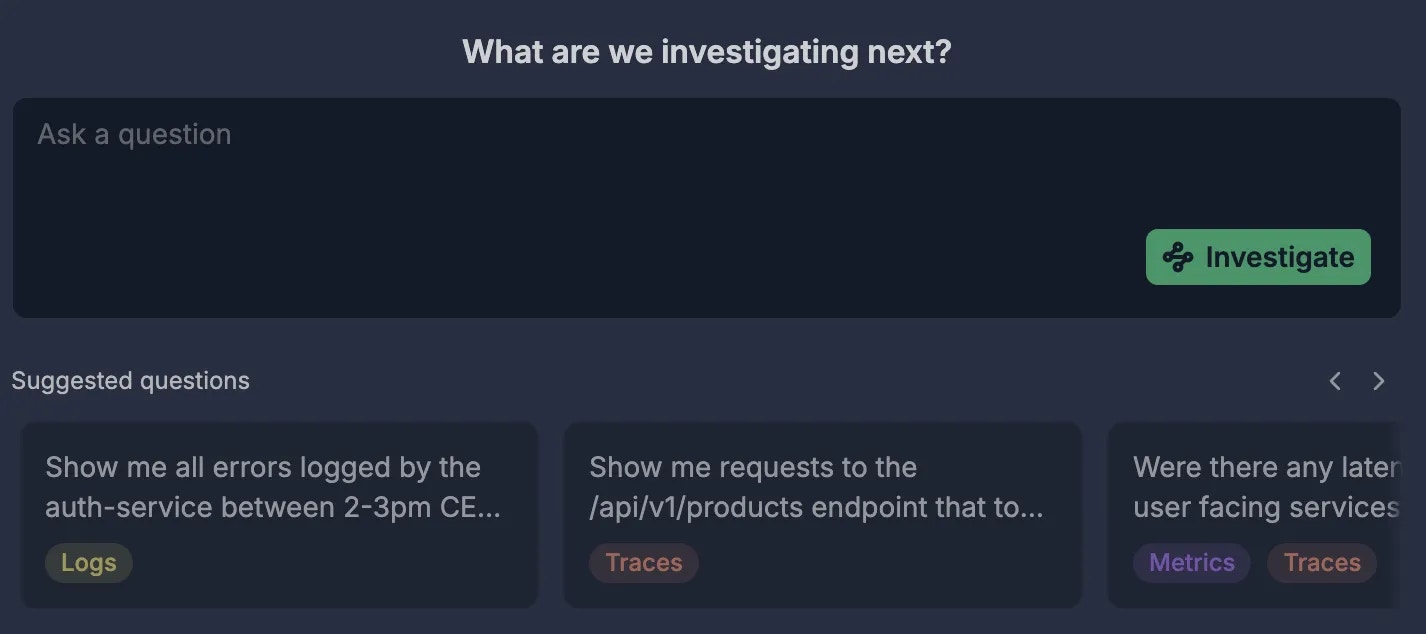
@Phoebe Show me all errors logged by the auth-service between 2-3pm CEST today.@Phoebe Why was there a sudden drop in traffic just before 11:30am today?@Phoebe Check for any 5xx errors in the last hour.@Phoebe Compare error rates for the checkout-api between this morning (8am-12pm) and yesterday morning.@Phoebe Do we have any OOM errors in the last 5 hours?@Phoebe What endpoints triggered the 500 errors?Performance monitoring
@Phoebe Show me requests to the /api/v1/products endpoint that took longer than 1000ms in the last 30 minutes.@Phoebe Were there any latency spikes in user-facing services over the past 2 hours?@Phoebe Get me metrics for average latency on HTTP endpoints.@Phoebe Find logs indicating resource saturation (e.g., high CPU or memory usage warnings) on any worker-node.@Phoebe Give me a summary of the state of metrics for the last couple of hours?Commit & Code
@Phoebe Can you highlight places in the code that could cause frontend failures?@Phoebe Any github commits over the past few days that could have impacted <service> performance?@Phoebe PR123 is being shipped. What is it about? What logs or traces should I monitor to be sure nothing is breaking? Anything else I need to pay attention?Correlations
@Phoebe Search for any issues in the logs, and find what in the code is causing the issue.@Phoebe Show me errors from the web-frontend service that occurred within 5 minutes of a database-primary node reporting high latency.@Phoebe Were there any deployment notifications from our CI/CD logs around the same time we saw a spike in 5xx errors on the api-gateway?Security & auditing
@Phoebe Show me all failed login attempts across all authentication logs in the last 2 hours.@Phoebe Are there any logs indicating potential SQL injection attempts (e.g., containing ' OR 1=1)?